독일 보쉬(Bosch)사의 BMP180 센서는 BMP085를 대체해서 보다 더 정밀한 기압 및 온도를 측정할 수 있다. 고도에
따라 기압은 달라지므로 기압을 바탕으로 고도를 측정할 수 있다. 고도가 높아지면 기압이 낮아지고 고도가 낮아지면 기압이 높아지는
원리를 이용하는 것이다. 이를 기압고도(Pressure Altitude)라고 한다. BMP180센서는 I2C (Inter
Integrated Circuit) 통신 프로토콜을 통해서
데이터를 추출
할 수 있다.
Characteristic
Value
Unit
Supply
Voltage
1.5 ~ 3.6
V
Supply
Current
Ultra low power mode : 3
Standard mode : 5
High resolution mode : 7
Ultra high res. mode : 12
(1) 아두이노 UNO R3와 연결해서 온도, 고도, 압력 데이터 출력 하기 본 제품은 내부에 회로적으로 3.3V전원
레듈레이터와 I2C 레벨쉬프터를 내장하고 있어서 5.0V와 3.3V 에서 모두 사용이 가능 하다. STM32, 라즈베리파이 등과
같이 3.3V 전원을 사용하는 프로세서에서 사용할 경우에는 VCC 대신에 3.3V 핀을 통해서 전원을 바로 연결해 주면 된다.
(1) 프로세싱 설치 -
프로세싱 개발환경 설치 하기(새창)
프로세싱코드는 BMP180 모듈에서 출력하는 데이터를 시리얼(RS232) 통신을
통해서 입력을 받아 데이터를 처리 하도록 되어 있다. 이제 아두이노와 BMP180 모듈을 이용해서 프로세싱에서 처리 하기 위한
데이터 출력을 해보자.
3.2
아두이노 UNO R3 배선도
배선도는 이전 예제와 동일하다.
3.3
아두이노 스케치 코드
(1) 아두이노 프로세싱 코드
프로세싱 코드에서 한가지 주의 해야할 사항은 처리 속도를 빠르게 하기 위해서 시리통 통신의 속도를 115200bps 로 설정을
하였다. 그렇기 때문에 아두이노의 시리얼 모니터창에서도 동일한 통신속도를 맞추어 주어야 한다.
아두이노 시리얼 모니터창에서 반드시 보드레이트(Baudate)를 115200 으로 수정 해야 한다. 그렇지
않으면 시리얼 모니터 창에 아무런 데이터가 표시되지 않거나 잘못된 데이터가 표시될 것이다. 프로세싱 데이터를 처리하기 위한
데이터 이므로 데이터를 바로 판독하기는 어렵다. 데이터가 올바르게 표시되는것을 확인 하였다면 프로세싱에서 동일한 시리얼포트를
사용해야 하기 때문에 아두이노 시리얼 모니텅 창을 닫도록 하자.
3.4
프로세싱 코드
프로세싱 코드에서 한가지 주의 해야할 사항은 시리얼 포트를 각자의 환경에 맞추어서 수정을 해주어야 한다는 것이다.
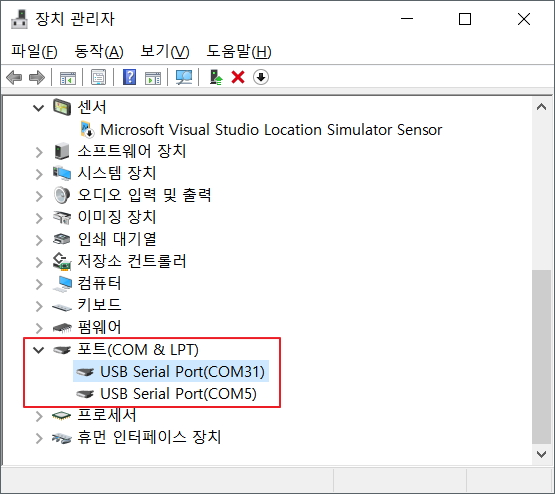
아래 프로세싱 코드에서 "[0]" 의 0이라는 숫자는 장치관리자에서 COM포트의 번호가 아니라 포트의 순서라는것에 주의 해야 한다.
위의 장치관리자 화면에서 예를 든다면 다음과 같다.
Serial.list()[0]; // --> COM31
Serial.list()[1]; // --> COM5

프로세싱 코드를 실행할때 테스트하는 PC의 COM 포트 상태에 따라서 "Serial.list()[0]" 의 숫자를 바꾸어 주어야 한다.
(1) 프로세싱 코드
/* BMP085/BMP180 Barometric Pressure & Temperature Sensor. Processing for BMP085_processing.ino Read more: http://www.jarzebski.pl/arduino/czujniki-i-sensory/czujniki-cisnienia-bmp085-bmp180.html GIT: https://github.com/jarzebski/Arduino-BMP085-BMP180 Web: http://www.jarzebski.pl (c) 2014 by Korneliusz Jarzebski */ import processing.serial.*; Serial myPort; // Data samples int actualSample =0; int maxSamples =70; int sampleStep =10; boolean hasData =false; // Charts PGraphics pgChart; int[] colors = { #ff4444, #33ff99, #5588ff }; String[] compareSeries = { "Integer", "Float", "Float+SOSS" }; // Data for compare float[][] pressureValues =newfloat[3][maxSamples]; float[][] temperatureValues =newfloat[3][maxSamples]; float[][] altitudeValues =newfloat[3][maxSamples]; voidsetup () { size(770, 670, P2D); background(0); // Serial myPort =new Serial(this, Serial.list()[0], 115200); myPort.bufferUntil(10); } voiddrawChart(String title, String[] series, float[][] chart, int x, int y, int h, boolean symmetric, boolean fixed, int fixedMin, int fixedMax, int hlines) { int actualColor =0; int maxA =0; int maxB =0; int maxAB =0; int min =0; int max =0; int step =0; int divide =0; if (fixed) { min = fixedMin; max = fixedMax; step = hlines; } else { if (hlines >2) { divide = (hlines -2); } else { divide =1; } if (symmetric) { maxA = (int)abs(getMin(chart)); maxB = (int)abs(getMax(chart)); maxAB = max(maxA, maxB); step = (maxAB *2) / divide; min =-maxAB-step; max = maxAB+step; } else { min = (int)(getMin(chart)); max = (int)(getMax(chart)); if ((max >=0) && (min <=0)) step = (abs(min) + abs(max)) / divide; if ((max <0) && (min <0)) step = abs(min - max) / divide; if ((max >0) && (min >0)) step = (max - min) / divide; if (divide >1) { min -= step; max += step; } } } pgChart = createGraphics((maxSamples*sampleStep)+50, h+60); pgChart.beginDraw(); // Draw chart area and title pgChart.background(0); pgChart.strokeWeight(1); pgChart.noFill(); pgChart.stroke(50); pgChart.rect(0, 0, (maxSamples*sampleStep)+49, h+59); pgChart.text(title, ((maxSamples*sampleStep)/2)-(textWidth(title)/2)+40, 20); // Draw chart description String Description[] =new String[chart.length]; int DescriptionWidth[] =newint[chart.length]; int DesctiptionTotalWidth =0; int DescriptionOffset =0; for (int j =0; j < chart.length; j++) { Description[j] =" "+series[j]+" = "; DescriptionWidth[j] += textWidth(Description[j]+"+000000.00"); Description[j] += nf(chart[j][actualSample-1], 0, 2)+" "; DesctiptionTotalWidth += DescriptionWidth[j]; } actualColor =0; for (int j =0; j < chart.length; j++) { pgChart.fill(colors[actualColor]); pgChart.text(Description[j], ((maxSamples*sampleStep)/2)-(DesctiptionTotalWidth/2)+DescriptionOffset+40, h+50); DescriptionOffset += DescriptionWidth[j]; actualColor++; if (actualColor >= colors.length) actualColor =0; } // Draw H-Lines pgChart.stroke(100); for (float t = min; t <= max; t=t+step) { float line = map(t, min, max, 0, h); pgChart.line(40, h-line+30, (maxSamples*sampleStep)+40, h-line+30); pgChart.fill(200, 200, 200); pgChart.textSize(12); pgChart.text(int(t), 5, h-line+34); } // Draw data series pgChart.strokeWeight(2); for (int i =1; i < actualSample; i++) { actualColor =0; for (int j =0; j < chart.length; j++) { pgChart.stroke(colors[actualColor]); float d0 = chart[j][i-1]; float d1 = chart[j][i]; if (d0 < min) d0 = min; if (d0 > max) d0 = max; if (d1 < min) d1 = min; if (d1 > max) d1 = max; float v0 = map(d0, min, max, 0, h); float v1 = map(d1, min, max, 0, h); pgChart.line(((i-1)*sampleStep)+40, h-v0+30, (i*sampleStep)+40, h-v1+30); actualColor++; if (actualColor >= colors.length) actualColor =0; } } pgChart.endDraw(); image(pgChart, x, y); } voiddraw() { if (!hasData) return; background(0); drawChart("Pressure compare [Pa]", compareSeries, pressureValues, 10, 10, 150, false, false, 0, 0, 4); drawChart("Temperature compare [C]", compareSeries, temperatureValues, 10, 230, 150, false, false, 0, 0, 2); drawChart("Altitude compare [m]", compareSeries, altitudeValues, 10, 450, 150, false, false, 0, 0, 2); } floatgetMin(float[][] chart) { float minValue =0; float[] testValues =newfloat[chart.length]; float testMin =0; for (int i =0; i < actualSample; i++) { for (int j =0; j < testValues.length; j++) { testValues[j] = chart[j][i]; } testMin = min(testValues); if (i ==0) { minValue = testMin; } else { if (minValue > testMin) minValue = testMin; } } return ceil(minValue)-1; } floatgetMax(float[][] chart) { float maxValue =0; float[] testValues =newfloat[chart.length]; float testMax =0; for (int i =0; i < actualSample; i++) { for (int j =0; j < testValues.length; j++) { testValues[j] = chart[j][i]; } testMax = max(testValues); if (i ==0) { maxValue = testMax; } else { if (maxValue < testMax) maxValue = testMax; } } return ceil(maxValue); } voidnextSample(float[][] chart) { for (int j =0; j < chart.length; j++) { float last = chart[j][maxSamples-1]; for (int i =1; i < maxSamples; i++) { chart[j][i-1] = chart[j][i]; } chart[j][(maxSamples-1)] = last; } } voidserialEvent (Serial myPort) { String inString = myPort.readStringUntil(10); if (inString != null) { inString = trim(inString); String[] list = split(inString, ':'); String testString = trim(list[0]); if (list.length !=9) return; // Temperature compare temperatureValues[0][actualSample] = (float(list[0])); temperatureValues[1][actualSample] = (float(list[1])); temperatureValues[2][actualSample] = (float(list[2])); // Pressure compare pressureValues[0][actualSample] = (float(list[3])); pressureValues[1][actualSample] = (float(list[4])); pressureValues[2][actualSample] = (float(list[5])); // Pressure compare altitudeValues[0][actualSample] = (float(list[6])); altitudeValues[1][actualSample] = (float(list[7])); altitudeValues[2][actualSample] = (float(list[8])); if (actualSample >1) { hasData =true; } if (actualSample == (maxSamples-1)) { nextSample(temperatureValues); nextSample(pressureValues); nextSample(altitudeValues); } else { actualSample++; } } }